
What's happening in the UK's property market today?
It isn't all doom and gloom like the media would make you want to believe...
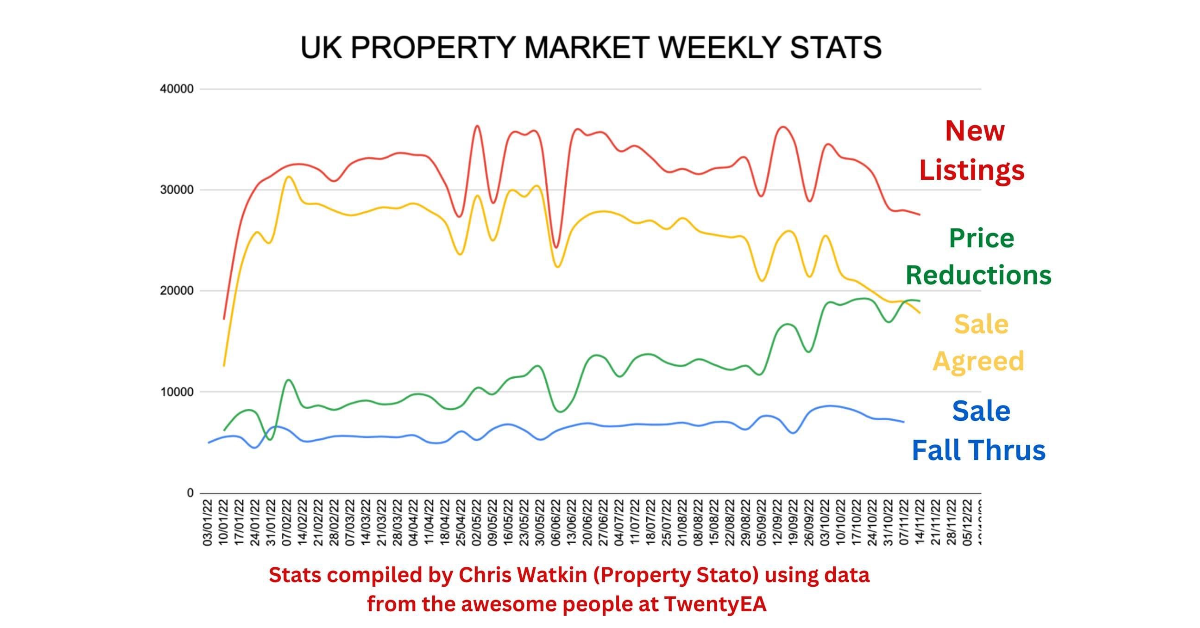
This graph shows the number of house sales (yellow line) dropping but if this was in a newspaper it would be doom and gloom...
Yet with all things like this, the devil is in the detail.
For the housing market, 2020 and 2021 were exceptional years:
- In Q4 2020, an average of 23,071 properties sold per week in the UK (sale agreed ie sold STC)
- In Q4 2021, an average of 21,051 properties sold per week in the UK
So with the average at 19,694 per week Quarter to date .. surely we should run for the hills? Until you look at the averages for 2016 to 2019.
- In Q4 2019, an average of 16,263 properties sold per week
- In Q4 2018, an average of 15,922 properties sold per week
- In Q4 2017, an average of 15,721 properties sold per week
- In Q4 2016, an average of 15,811 properties sold per week
(Stats from TwentyEA)
From the statistic we are just going back to the ways things were before lockdown, so stop believing everything you read in the media.


Share this with
Email
Facebook
Messenger
Twitter
Pinterest
LinkedIn
Copy this link